Expert Visualisation
We can help you visualise your data, whether it's real-time, historical or a combination of both.
Graphing
Many of ITDev's projects require graphs.
For example:
- 2D line graphs
- Bar charts
- Pie charts
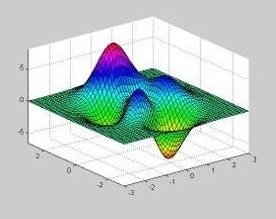
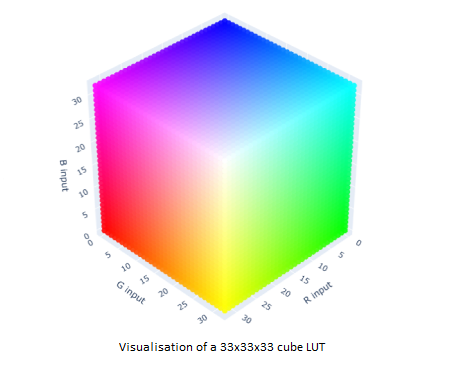
- 3D surface plots
We can implement graphs that will render large datasets quickly and efficiently, and offer facilities such as multiple cursors, legends, zooming and panning.
We will use off-the-shelf graphing libraries or open source graphing software, where practical, to reduce the development cost. We recently developed a 3D data visualisation application for Android using the OpenGL graphics library. We can also use graphing components from NI LabVIEW.
ITDev released its proprietary Perl graphing module, Tk::PlotDataset, to the open source community in 2007. For more information and to download Tk::PlotDataset click here.
