Here at ITDev, we believe FPGA development can be efficient and enjoyable but we’ve all had projects before where that hasn’t been the case. Maybe a bug crept in and you can’t tell when, or you went over 100% resource utilisation without noticing it. This is where using Continuous Integration (CI) tools like Jenkins can be useful. They can do all the tedious work so that us engineers can focus on the fun bits: implementation, verification and problem solving!
Over the course of this blog, I’m going to look at a few areas where we have seen great benefit to projects:
- Regular Builds and Linting
- Unit testing
- Resource and Timing Tracking
Where we use third party tools, I’ll give an example but there are lots of free and paid for alternatives to choose from. Links to all the tools can be found at the end of the blog.
If you like the sound of this blog, but are completely lost don’t worry, take a look at our blogs on CI concepts.
Regular Builds and Linting
This is the easiest thing to set up and can save many headaches. We tend to split this into two: a simulator compile (e.g. Modelsim or Verilator) and an FPGA build (usually using Xilinx’s Vivado or Intel’s Quartus). The reason for the split is that you may want to run a quick simulator compile on every commit but only run synthesis once a day (depending on how long it takes).
Having a job that does a build is useful but ideally, we want to pull out the pertinent information. That’s where tools such as the Warnings Next Generation plugin for Jenkins come in. This tool comes with a load of tools to parse standard log formats (e.g. GCC or similar). Most software engineers will be satisfied with this list but the list of supported FPGA tools is less impressive. They helpfully provide a way to create tools on the fly in the Jenkins GUI, but to save you time our own Accelerate CI product comes with built in Warning Parsers for Vivado, Quartus and Modelsim logs for instant set up.
The Warnings plugin gives you a sortable/filterable table of warnings for each build and even shows you trends over time. This can be useful for tools that are a bit over-enthusiastic about warnings; if you don’t want to fix them at least you can check the number of warnings doesn’t increase. This can be compared to the previous build, or a different branch or release.
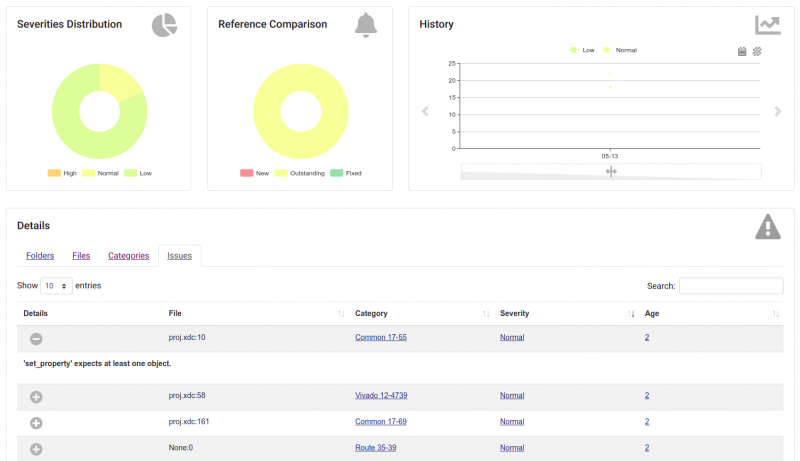
Vivado Warning Parser for Accelerate CI
Unit Testing
Unit testing can be very useful, especially on large projects where system testing won’t begin for a long time. Nobody wants to get weeks into a project with no feedback that functionality has been implemented correctly. As a design consultancy, it is especially important to us that clients can see a measure of progress throughout the project. Depending on the project, we have two approaches to unit testing:
- During feature implementation we develop a unit test. This unit test will be re-run in future CI builds to check nobody breaks the feature.
- Tests (or empty placeholders) are written up front and are expected to fail at the start of implementation. As features are implemented tests begin to pass.
Either way, progress can be tracked as tests are added or move from failing to passing. But we need a plugin to show this information in Jenkins. We tend to use xUnit, a plugin that supports multiple test result formats, to parse results. Separate to this, we use Test Results Analyzer plugin to display the results. This fits nicely with our choice of HDL unit testing: VUnit. For more information on this subject, why not read our blog or check out VUnit's home page. VUnit has a parameter -x XUNIT_XML that allows you to output your tests results as an XML file compatible with the xUnit plugin using the JUnit format. This works with both Jenkins and Bamboo.
Like the warnings plugin, we not only get current results but also get trends over time. This can help pinpoint which submission first broke a test.
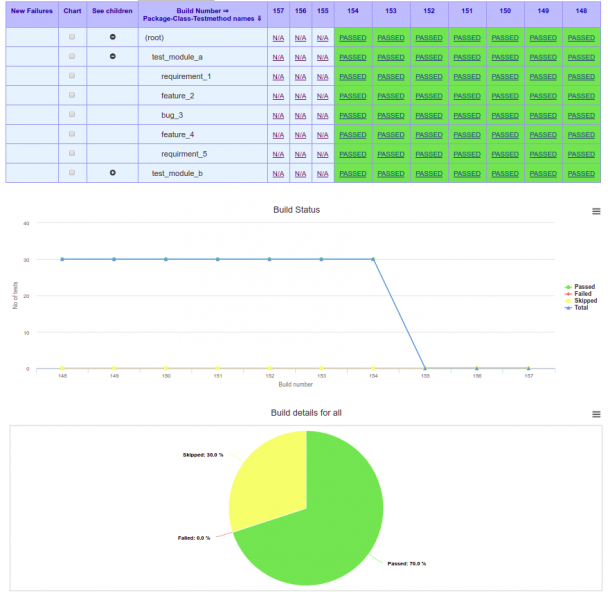
Test Result Analyzer Dashboard
Resource and Timing Tracking
So far, the Warnings plugin has allowed us to make sure we maintain a high quality of code, and the xUnit plugin has allowed us to track progress and prevent regression. But at the end of the day, we need to know about resource usage and clock speed. Ideally, we want to know about any potential issues in either as soon as possible. That’s why we use the Plot plugin to show a plot of the useful figures. We first run a helper script which we wrote (shown below) to extract the figures from the tool reports and generate a csv file before the tool can generate the graphs. Using this information on how much of the implementation has been completed can be a useful way to estimate final resource utilisation and clock speed.
The following BASH snippet is a very crude way to convert a Quartus summary file to a csv table of the format required by the plot plugin:
# Grab the percentage data from summary
TABLE="$(sed -rn 's/([^:]*) :.* ([0-9]*) %.*/\1\t\2/p' $1)\n"
# Count the number of rows
ROWS=$(printf "$TABLE" | wc -l)
FMT=$(python -c "print '- ' * $ROWS")
# Transpose columns to rows
ROW1=$(printf "$TABLE" | cut -f1 | paste -d, $FMT)
ROW2=$(printf "$TABLE" | cut -f2 | paste -d, $FMT)
# Output
printf "$ROW1\n$ROW2\n"
Giving us a CSV output like this:
| Logic utilization (in ALMs) | Total pins | Total block memory bits | ... | Total HSSI PMA TX |
|---|---|---|---|---|
| 25 | 28 | 5 | ... | 0 |
Which results in a graph like this:
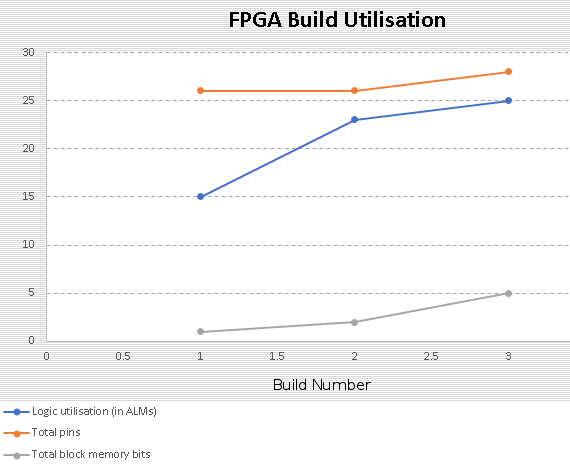
FPGA Utilisation Plots
So What?
All this information can be helpful. We believe that issues should be caught as early as possible, so we run a large amount of CI testing during code review (using integration with Reviewboard or Gerrit). Failing tests and Compile error reports can be used by the code author to fix their code before asking colleagues to perform a code review. In parallel with this, we tend to have Jenkins run checks periodically if new submissions to the master (or trunk) have been made. This ensures that if any issues slip through the net, we find them as quickly as possible.
Whether you use Jenkins or Bamboo, to set up your own environment or employ a setup such as Accelerate CI, I would advise you to pair CI with FPGA development. It helps you catch issues early, prevents human error from going unnoticed and helps track the progress of projects. What more could you want?
There are also plenty of other things you can add in, such as including Modelsim’s HTML code coverage report, or using system test tools to run nightly FPGA tests with real hardware, but these topics are for another day.
Tool Links
- AccelerateCI - https://www.itdev.co.uk/aci
- Jenkins - https://www.jenkins.io
- Plot Plugin - https://plugins.jenkins.io/plot/
- Test Results Analyzer Plugin - https://plugins.jenkins.io/test-results-analyzer/
- VUnit - https://vunit.github.io/
- Warnings Next Generation Plugin - https://plugins.jenkins.io/warnings-ng/
- xUnit Pugin - https://plugins.jenkins.io/xunit/
Main image: Jenkins on a computer chip
Interested in other ITDev CI blogs?
Here at ITDev we have been utilising Continuous Integration (CI) on client projects for many years and have built extensive experience on the subject. Helping the industry to adopt best practice we have written introductory and more advanced blogs on the subject. See this search index on other CI related blogs.
How ITDev Can Help
At ITDev we believe good engineering practice is essential to delivering high quality, engineered designs. Aligned with this, we run a series of events and workshops to help develop industry best practices through collaborative sharing and learning.
ITDev provides technology consultancy as well as hardware & software design services; our team of engineers has extensive experience in FPGA design for both Xilinx and Intel (formerly Altera) devices.
In line with our other areas of expertise, we offer advice and assistance to companies considering investing in CI and other workflow improvements. We use our experience and library of in-house scripts to quickly deliver ready to use CI environments customised to fit your own project requirements. If you are interested in attending a workshop on CI, or receiving more information on this topic, please sign up to the ITDev Continuous Integration Interest Group.

If you have any questions or would like to find out how we can help you, initial discussions are always free of charge and we would be delighted to speak to you. Email us or call us on +44 (0)23 8098 8890.